Rating Points and Team Success
Champion Data’s ‘equity rating’ for scoring likelihood comes as advertised.
Champion Data have been the official AFL data partner since 1999. They are responsible for capturing, analysing, and delivering all sorts of statistics related to the sport.
One of their statistics – player ratings points – has been on my mind lately.
Dubbed as company’s “most definitive number to define influence on matches”, Champion Data’s Christian Jolly described player ratings points as “an equity rating measurement… where you win the ball and where you get the ball to” in an appearance on the ESPN Footy Podcast in 2023.
The rating takes field position and the level of pressure the player with the ball – and they player they give the ball to – into consideration, as well as all the usual statistics such as hit outs, tackles, and interceptions that form part of the game.
“An equity rating is basically who is going to score next – from what you’re doing are you more likely [or not] to score next,” Jolly said.
This particular metric was first used in 2010, but seems (to me, at least) to have been featured in, and/or be the focus of, a greater number of stories this season compared to years gone by.
This got me wondering if and how the ratings points are related to team success, because it makes sense that if enough players on a team have high ratings points totals, then that team should be much more likely to score on more occasions than their opponent.
And since good teams typically take advantage of their scoring chances more often than not, this would theoretically translate into higher scores (and winning more games).
Winning (more often than not)
There have been 189 games to date in the current AFL season. Of the 186 games that didn’t end in a draw, the winning team had a higher rating points total 168 times. This translates to 90.32% of games.
The other 18 winning teams had a lower rating points total than their opponent on 17 occasions (9.14% of games), while there was one game where the winning team finished on the same rating points total as their opponent (0.54%).
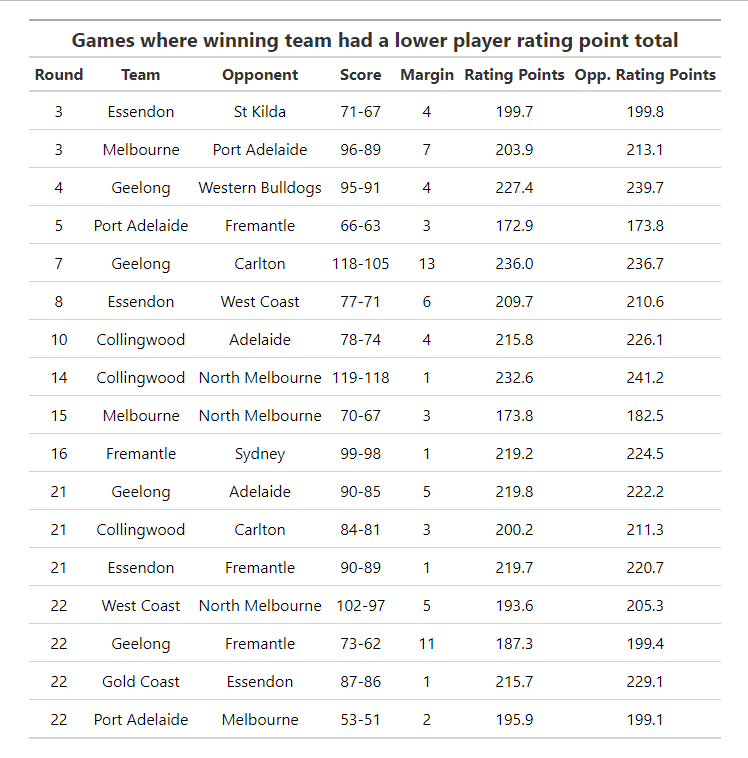
Amazingly, seven of the 17 games where the winning team had a lower rating points total have occurred in the last two weeks, which reinforces how competitive this season has been.
Essendon, Fremantle, and Geelong all appear twice in the table above, following their close games over the past fortnight.
Higher ratings point totals lead to higher scoring
Given the association between a higher ratings point total and the outcome of the game, it’s no surprise to see the following distribution when we graph a team’s ratings point total against the score for that particular game.
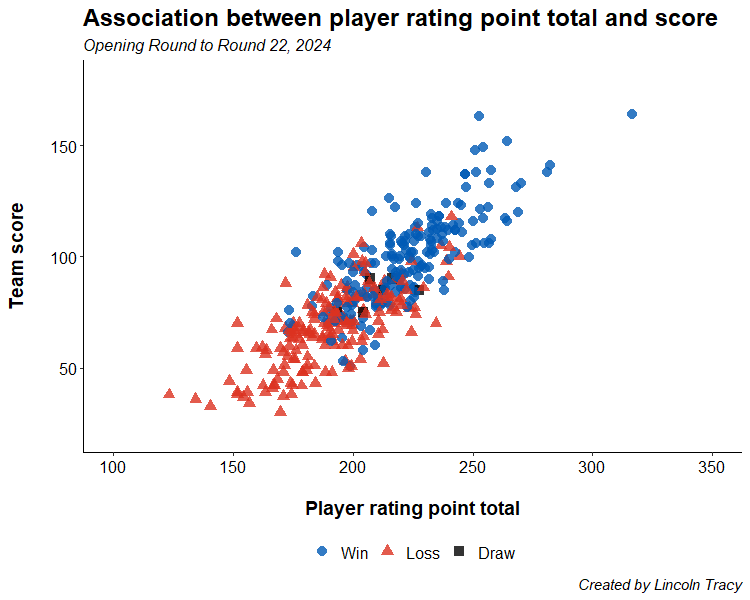
It’s also not surprising to see that the team with the highest ratings point total to date (Gold Coast, 316.5) has resulted in the highest score for the season (164 v Geelong in round 10).
But interestingly, the second highest score for the season (Brisbane’s 163, in their 119-point win over Richmond, which also occurred in round 10) came from a game where the Lions registered the nineteenth highest ratings point total (252.9).
On the other end of the spectrum, the lowest ratings point total for the year (West Coast’s 123.1 in their 99-point loss to Adelaide in round 11) is tied for seventh in terms of the lowest number of points scored in a game (38).
Meanwhile, the lowest score for the year (West Coast again, who only scored 30 points against the Western Bulldogs in round 3) came from a game with the ratings point total of 169.7, which falls outside the 25 lowest ratings point totals for the year.
Turns out Champion Data are pretty much on the money with this metric.
The timeframe of this stat is limited based on what data are freely/easily available and/or accessible. Please don’t hesitate to contact me if you spot any errors in what I have presented.